Imagine it's a Saturday morning in Santa Monica in the year 2080. You make your coffee, open your front door, and breathe in the hot, dry air of… San Bernardino?
That's the potential future if climate change continues unabated, according to a new mapping tool from researchers at the University of Maryland's Center for Environmental Sciences. The tool draws direct lines between the projected climate for an area 60 years from now and the places experiencing that climate today.
The map is “a really interesting way to communicate to people the magnitude of climate change we’re expecting,” said Matt Fitzpatrick, the tool’s creator and a professor of global change ecology.
He noted that sometimes warnings about global warming, such as international ones, Limits of 1.5 degrees Celsiusor predictions that the Earth will be 5 degrees Fahrenheit warmer by the end of the century, may seem distant or difficult to comprehend.
“These analyses were a way to get people to understand it,” Fitzpatrick said. “It’s a way to translate these abstract numbers into something much more tangible and meaningful.”
Aggressive and shocking reports on climate change, the environment, health and science.
The results are significant.
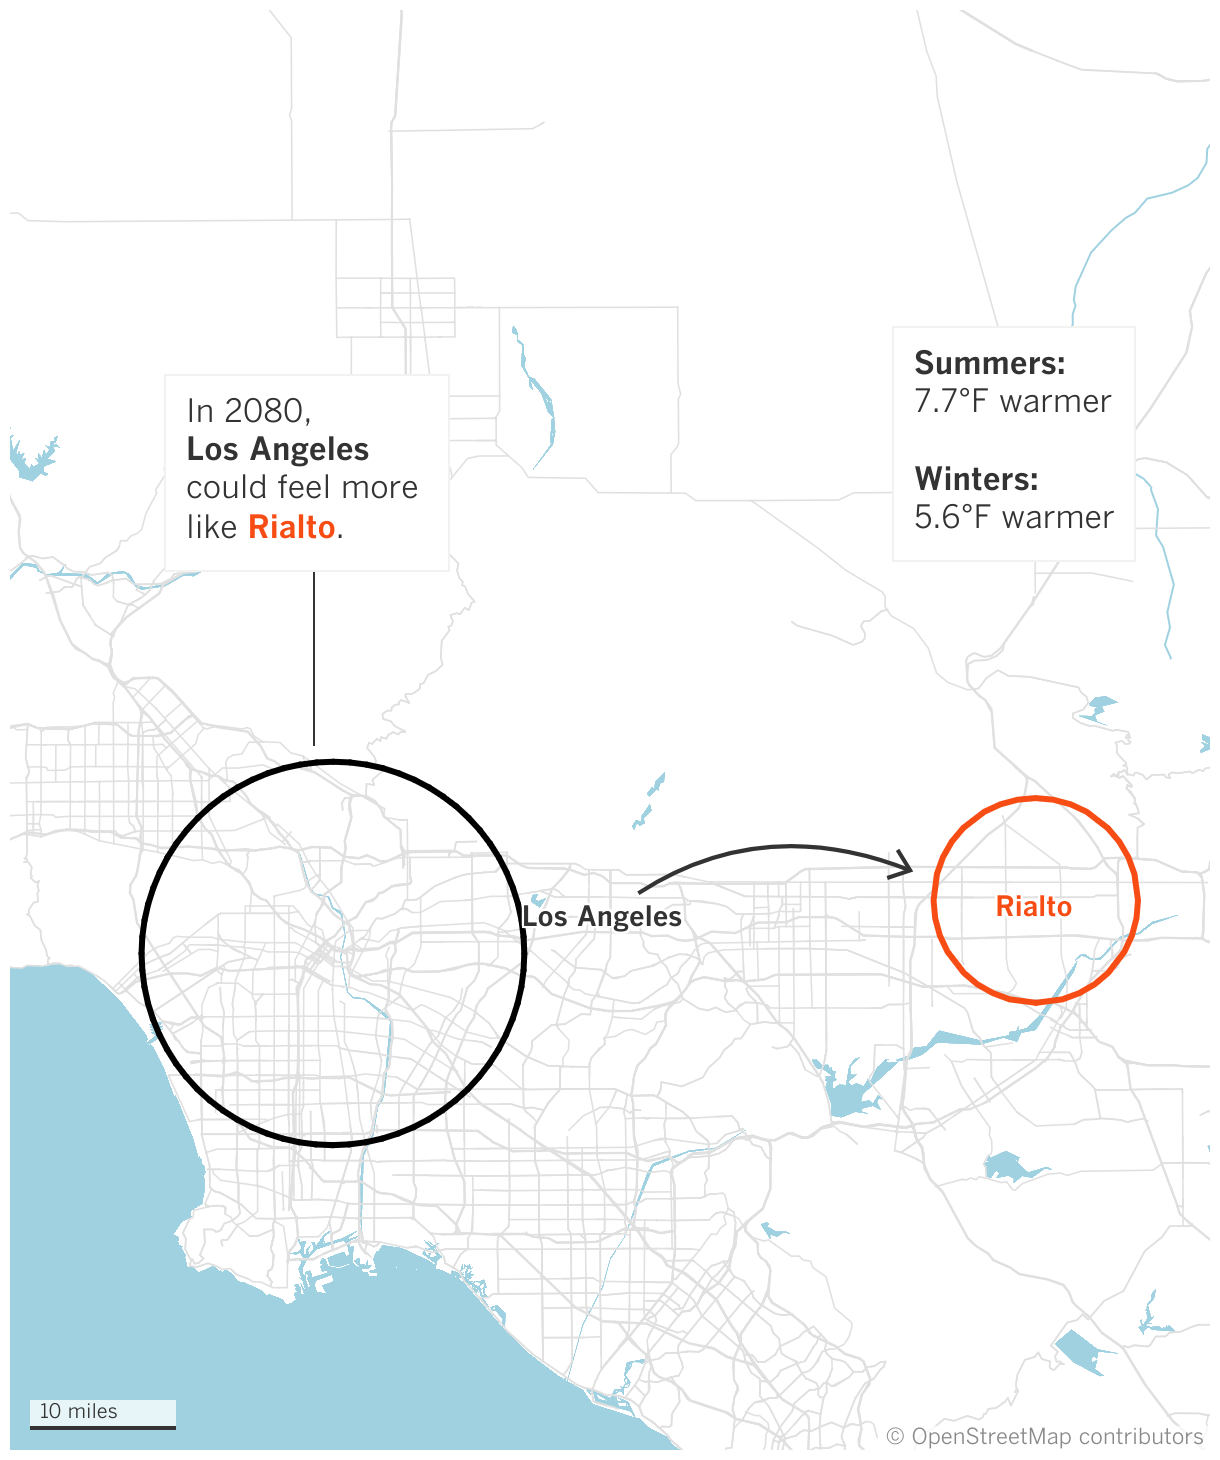
Under a high-emissions scenario — or one in which fossil fuel consumption and global warming continue unchecked — Los Angeles would have summers about 7.7 degrees warmer and winters about 5.6 degrees warmer, with an overall climate more like current conditions in Rialto, a city in southwestern San Bernardino County.
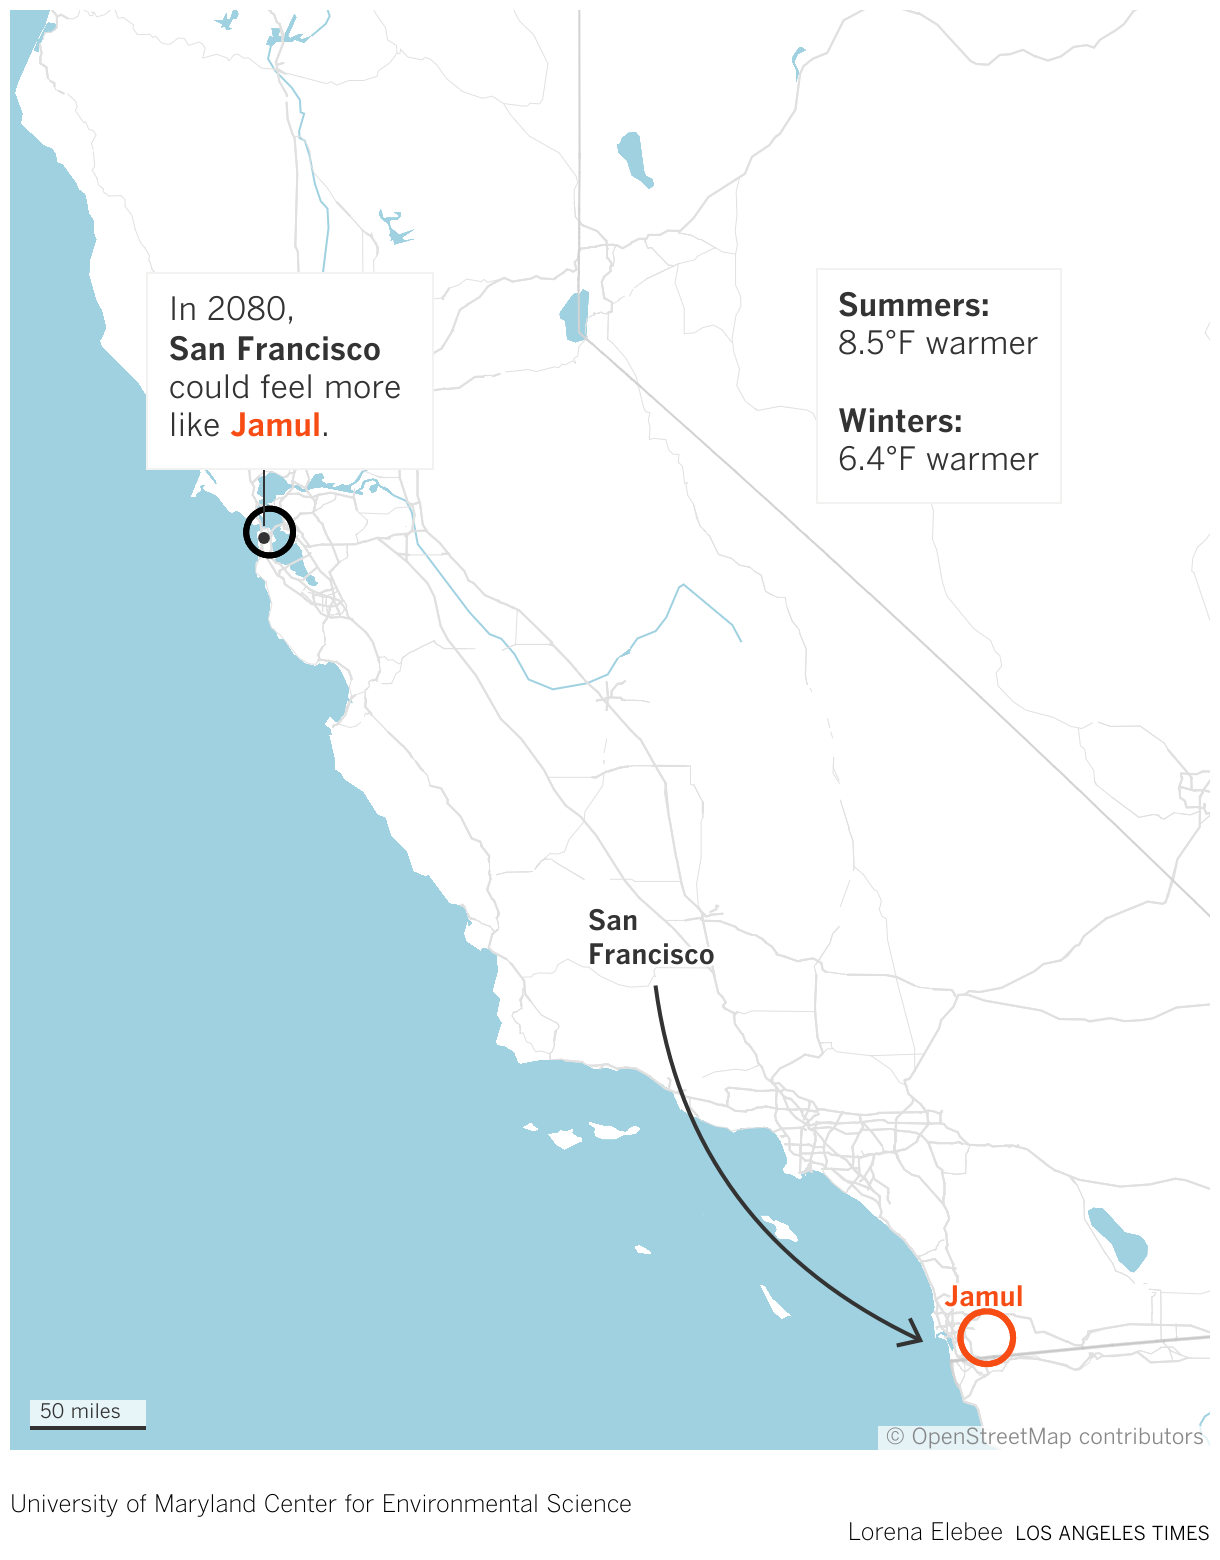
San Francisco will feel more like Jamul, a census-designated place in San Diego County not far from the Mexican border, with summers 8.5 degrees warmer and winters 6.4 degrees warmer.
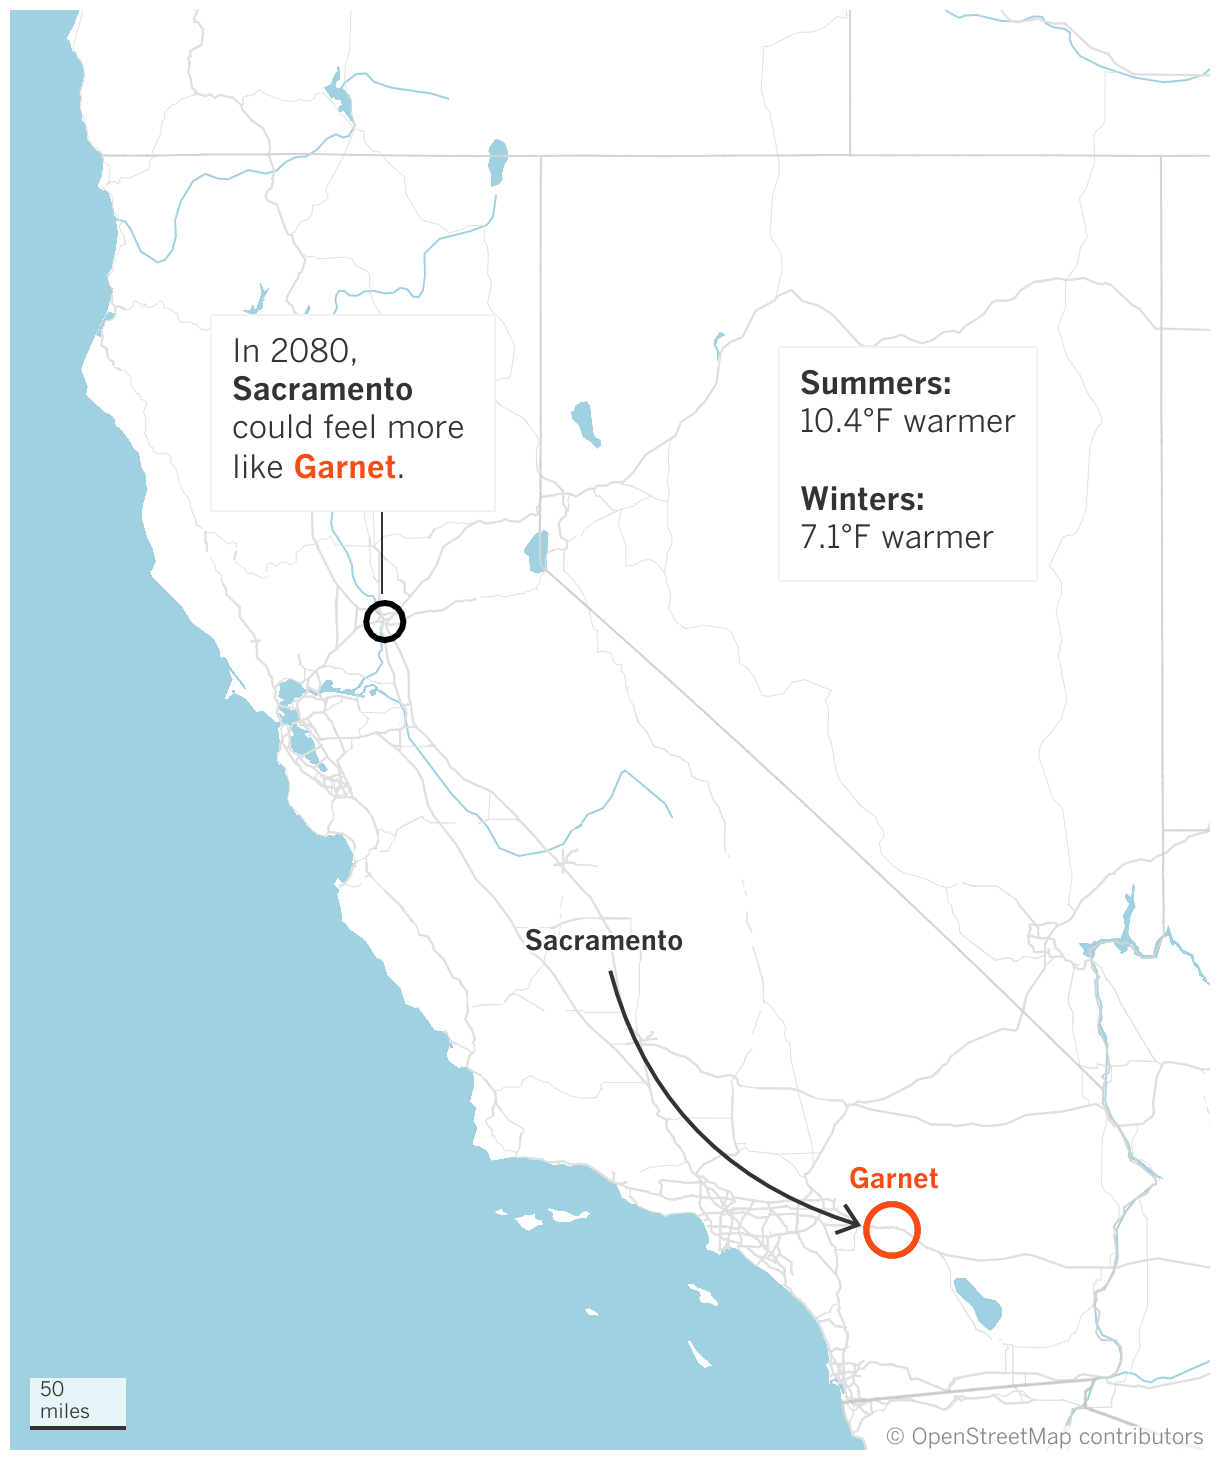
Sacramento will feel like Garnet, an area near Palm Springs in Riverside County, with summers 10.4 degrees warmer and winters 7.1 degrees warmer.
It's not just the temperature that will change. The map shows how precipitation could change as many parts of California are expected to see wetter summers and winters in addition to warmer ones. However, Fitzpatrick noted that Drought may become even more common because warmer conditions dry out the soil more quickly.
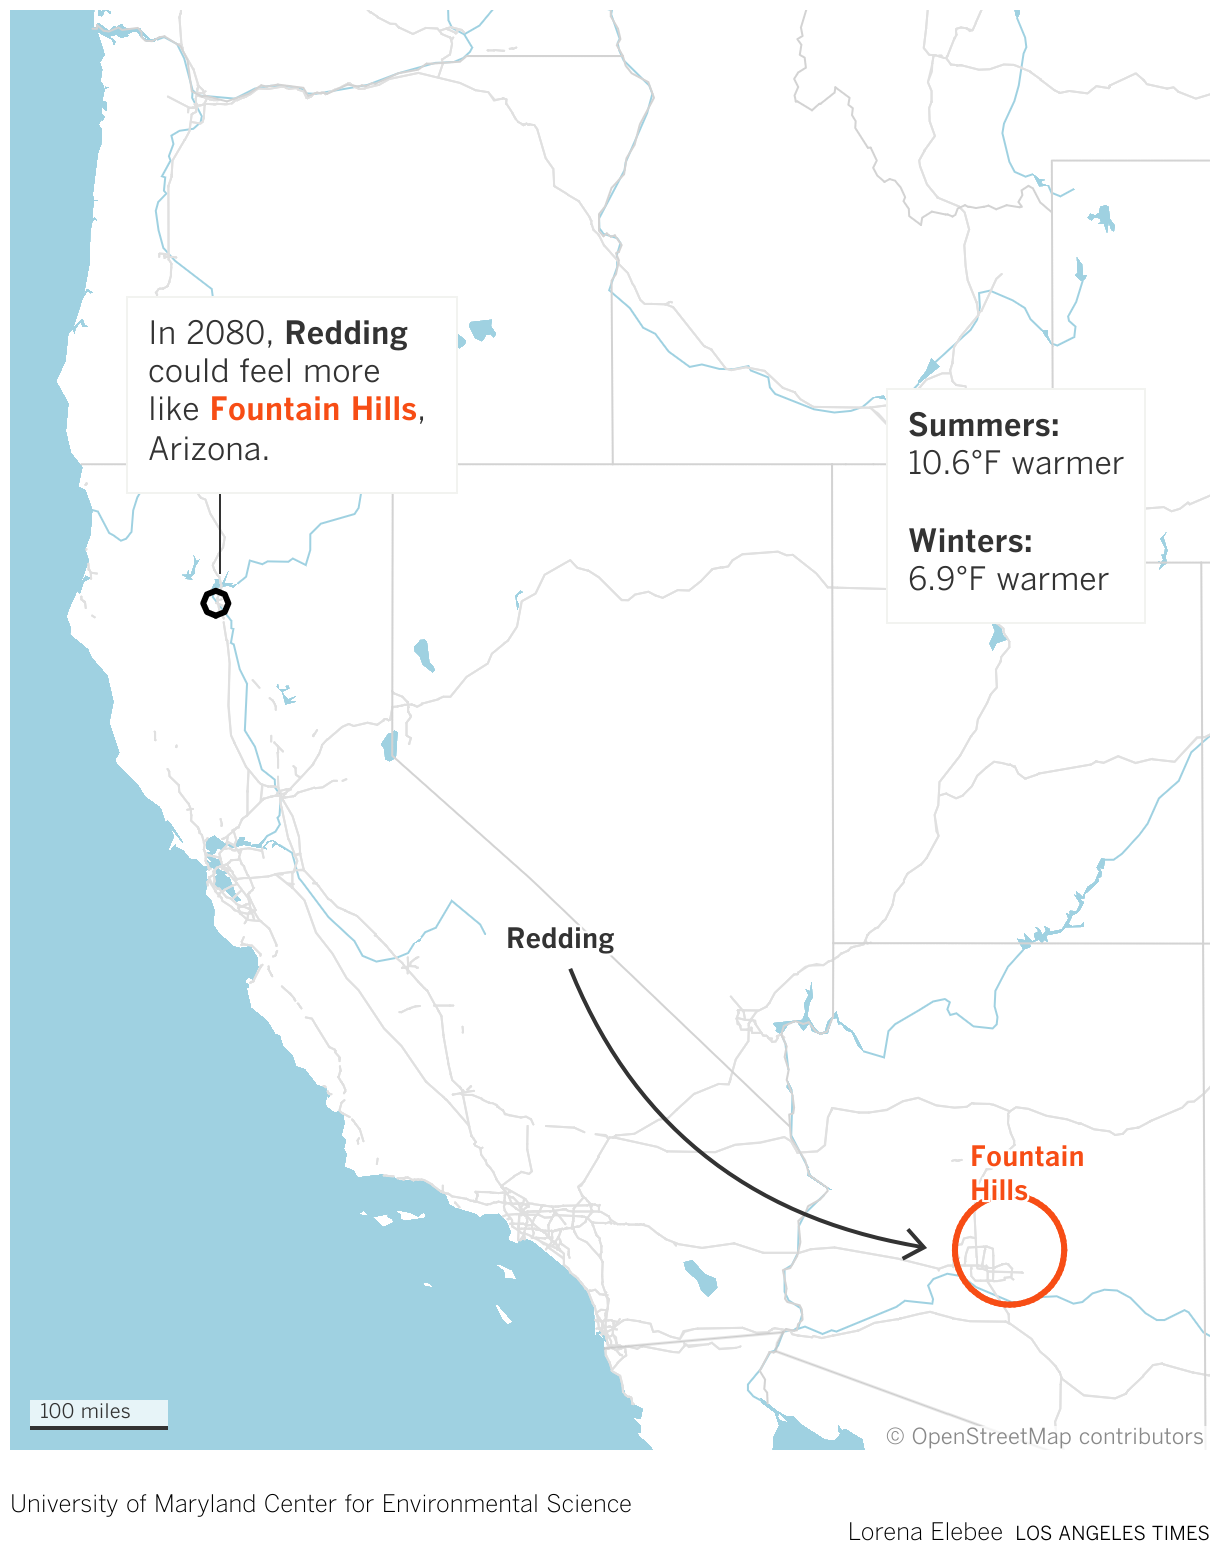
Vegetation is also expected to undergo a transition in a warming world, with places like Redding moving from a Mediterranean landscape defined by forests and shrublands to one that is more of a desert or xeric shrubland similar to Fountain Hills, Arizona, the map shows.
Fitzpatrick said the tool uses models from the Intergovernmental Panel on Climate Change and several other research groups to make its comparisons.
“I take the data produced by those models and do a relatively simple statistical analysis where I say, here’s the forecast for the Greater Los Angeles region by the end of the century, and then I say, what places on Earth have that climate today?” he said.
But it also explains what's at stake for people who are unhappy with outcomes in their area when comparing different outcomes based on humanity's ability to reduce the emissions that drive climate change.
In a lower-emissions scenario that limits fossil fuels, the best climate analog for Santa Monica would be Castaic, not Rialto.
Fitzpatrick modeled the various outcomes using two specific scenarios outlined by the intergovernmental panel.
The high emissions scenario used for modelling refers to a world in which carbon dioxide emissions double from current levels by 2100, leading to a steady rise in temperatures with average global warming of more than 6 degrees by the end of the century.
In such a world, food supplies will be compromised and countries will become more competitive for resources. Economic development will slow, as will investment in education and technological development, among other consequences.
The low scenario is considered the most optimistic. It describes a world in which global carbon emissions will be reduced to net zero around 2050 and societies will transition to more sustainable pathways, limiting global warming to 2.7 degrees, or 1.5 degrees Celsius. Inequality will decline and health and education will improve. While some extreme weather events will continue to occur, many of the worst outcomes of climate change will have been avoided.
The difference between the two scenarios is evident in the mapping tool. In the high-emissions scenario, the average distance to the nearest climate hotspot is about 620 miles, compared with less than half that distance — and in some cases less than 100 miles — in a low-emissions scenario, Fitzpatrick said.
“The longer we wait, the harder it will be to address this problem, but it’s not a hopeless situation. There’s still a lot we can do to try to avoid the worst effects,” he said. However, “we’re running a gigantic experiment on our planet right now, and things could get much worse. Scientists could just as easily be underestimating the results.” [as] They might be overpredicting.”
In fact, the tool's findings are likely conservative, according to Bill Patzert, a retired climatologist at NASA's Jet Propulsion Laboratory in La Cañada-Flintridge.
August and September in Los Angeles are already 7 to 8 degrees warmer than they were at the start of the 20th century, so while it's not surprising that the map would yield similar conclusions by 2080, the reality could be even worse, he said.
“The curve will continue to rise,” Patzert said. “It will continue to get warmer, and not only that, I guarantee it will be warmer than ever before.” [this map] “and the implications will be more serious in 10, 20 and 30 years from now than in the last 20 years,” he says.
In addition, Patzert said the map could do more to highlight the effects of those changes, including worsening wildfires, reduced water supplies and adverse effects on human health and the economy. Extreme heat is already the deadliest climate risk, and by 2080, heat-related mortality will be significant, he said.
“This is no longer an academic exercise,” Patzert said. “This is a serious matter, and the implications from now on will be worse than they were in the 20th century.”
And while the map draws direct connections, there is often no single analogy for a given place. In fact, the map’s “climate similarity surface” feature shows that the Los Angeles of 2080 will also feel like parts of Algeria, Jordan and Western Australia today.
In addition, some cities have no analogues, meaning there is no direct comparison to how hot they will feel in those places in the future. That includes some areas close to the equator and some parts of the Middle East, such as Aden, Yemen.
“The future climate at this location is expected to be unlike anything currently found anywhere on Earth, so there are no climate matches for this location,” the map says over Aden.
Significant changes are also being seen elsewhere in the world. In a high-emissions scenario, New York City will resemble parts of Texas, Chicago parts of Oklahoma, and Miami Saudi Arabia, the map shows. Internationally, Dublin will resemble Spain's Basque Country, London Nouvelle-Aquitaine in France, and Rome Berat in Albania.
Fitzpatrick said he chose to focus the analysis on 2080 because it is far enough away to show the magnitude of the expected impacts, but close enough that it will occur within many people's lifetimes and certainly within the lifetimes of the children who will be “living through this entire transition.”
One unexpected result is that some people like the results they're seeing, such as parts of Germany looking more like Italy in 2080, Fitzpatrick said.
“I really didn’t expect it,” he said. “But the trade-off is that it may be good for you, but it’s going to be very bad for everyone else overall. You guys in California know that.”
Newsletter
Towards a more sustainable California
Receive Boiling Point, our newsletter exploring climate change, energy and the environment, and be part of the conversation – and the solution.
You may occasionally receive promotional content from the Los Angeles Times.