- Labour votes plummet in areas with high Muslim populations.
- Muslim Vote and Henry Jackson Society publish report
- Muslims are a diverse group, they do not vote in unison or as a block.
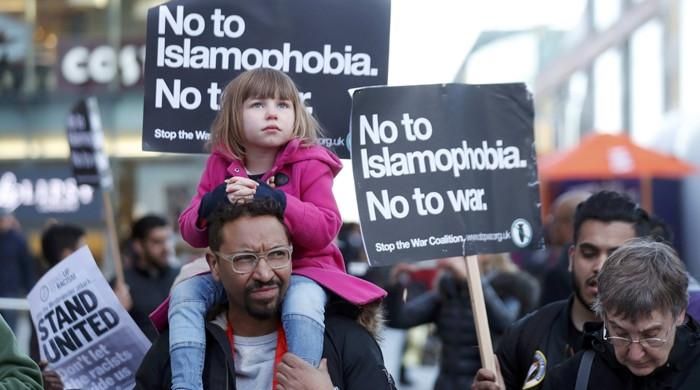
LONDON: The British Muslim vote could play a crucial role in around 100 constituencies, including most key seats across the country, according to a new study.
A new campaign group called The Muslim Vote and the right-wing Henry Jackson Society (HJS) have put the number of seats at 92 and 120 respectively, claiming that the population is more than 10% Muslim in around 100 seats.
Research by the Henry Jackson Society on religious diversity in UK constituencies puts the number where the Muslim vote could play a significant role at 120, especially in key constituencies.
The HJS said that of the 220 most marginal seats in the general election, Islam is the largest minority religion in 129 of them (58.6%); the second largest minority religion in marginal seats is Hinduism in 23 of them (10.5%), followed by Sikhism in six marginal seats (2.7%) and Judaism in three (1.4%).
The swing seats were identified by political consultancy Electoral Calculus, which defines a marginal seat as one in which the margin of victory is expected to be 10% or less.
The 220 marginal seats in the general election represent a third (33.8%) of all available seats. Martin Baxter, chief executive of Electoral Calculus, said the results of his most recent MRP survey with Savanta found religion to be a “significant factor” in how people vote.
A demonstration of this came when in local elections earlier this year, dozens of candidates from across the country stood on a Gaza ticket and defeated their Labour rivals, dealing a major blow to the Labour Party in areas it had taken for granted for decades.
Labour votes plummeted in areas with high Muslim populations, such as Blackburn, Bradford, Pendle, Oldham, Luton, London and Manchester. If the same pattern is repeated in the July 4 election at the hands of Gaza candidates, Labour support will plummet further in those areas.
The Muslim Vote, a campaign group set up by grassroots Muslim organisations to encourage Muslim voter turnout, has identified around 92 seats where Muslim voters make up more than 10% of the total vote.
However, all agree that Muslims are a diverse group and do not vote in unison or as a bloc, but are divided along political, ethnic and sectarian lines.
Geo News has prepared the following list of electoral districts:
1-Bradford West (54%)
2-Birmingham Hall Green and Moseley (49%)
3-East Ham (43%)
4-Blackburn (42%)
5-Ladywood Birmingham (42%)
6-Bethnal Green and Stepney (40%)
7-Dewsbury and Batley (39%)
8-Bradford East (39%)
9-Birmingham Perry Barr (38%)
10-Ilford South (37%)
11-Birmingham Yardley (37%)
12-Birmingham Hodge Hill (33%)
13-Leicester South (31%)
14-Poplar and Limehouse (30%)
15-Oldham West (28%)
6-Manchester Rusholme (27%)
17-Stratford and Bow (27%)
18-Swamp (27%)
19-North Luton (27%)
20-Ilford North (27%)
21-South Luton and South Bedfordshire (26%)
22-Rochdale (26%)
23-Barking (24%)
24-Gorton and Denton (24%)
25-Brent East (23%)
26-Leicester East (22%)
27-West Ham and Beckton (22%)
28-Queen's Park and Maida Vale (21%)
29-Walthamstow (21%)
30-Bolton South and Walkden (21%)
31-Edmonton and Winchmore Hill (20%)
32-Leyton and Wanstead (20%)
33-Walsall and Bloxwich (19%)
34-Huddersfield (18%)
35-Hayes and Harlington (17%)
36-Ealing North (17%)
37-Bradford South (17%)
38-Oldham East and Saddleworth (17%)
39-Ealing Southall (17%)
40-South Derby (16%)
41-Burnley (16%)
42-Wycombe (16%)
43-Preston (16%)
44-Smethwick (16%)
45-Holborn and St Pancras (16%)
46-Enfield North (15%)
47-Harrow West (15%)
48-Feltham and Heston (15%)
49-West Brent (15%)
50-Brentford and Isleworth (15%)
51-Peterborough (15%)
52-Sheffield Brightside and Hillsborough (15%)
53-Bolton North East (14%)
54-Ealing Central and Acton (14%)
55-Hendon (14%)
56-Halifax (14%)
57-Nottingham East (14%)
58-Tottenham (14%)
59-Manchester Central (13%)
60-Harrow East (13%)
61-Pendle and Clitheroe (13%)
62-Birmingham Edgbaston (13%)
63-Southgate and Wood Green (13%)
64-Blackley and Middleton South 13%)
65-Keighley and Ilkley (13%)
66-Newcastle upon Tyne Central and West (12%)
67-Hyndburn (12%)
68-West Croydon (12%)
69-Hackney North and Stoke Newington (12%)
70-Dagenham and Rainham (12%)
71-Cities of London and Westminster (12%)
72-Coventry East (11%)
73-Sheffield Central (11%)
74-Leeds North East (11%)
75-Birmingham Erdington (11%)
76-Chingford and Woodford Green (11%)
77-Middlesbrough and Thornaby East (11%)
78-Kensington and Bayswater (11%)
79-Mitcham and Morden (11%)
80-Hackney South and Shoreditch (11%)
81-Watford (10%)
82-Leeds East (10%)
83-Hampstead and Highgate (10%)
84-Birmingham Selly Oak (10%)
85-Sheffield South East (10%)
86-Stretford and Urmston (10%)
87-Bury North (10%)
88-Streatham and North Croydon (10%)
89-Hammersmith and Chiswick (10%)
90-Uxbridge and South Ruislip (10%)
91-North Islington (10%) Watford (10%)
92-Leeds East (10%)
93-Hampstead and Highgate (10%)
94-Birmingham Selly Oak (10%)
95-Sheffield South East (10%)
96-Stretford and Urmston (10%)
97-Bury North (10%)
98-Streatham and North Croydon (10%)
99-Hammersmith and Chiswick (10%)
100-Manchester Withington (11%)

