It was the year that COVID-19 vaccines became widely available and the pandemic’s alarming death toll in California and elsewhere seemed close to being brought under control.
In contrast, life expectancy in California fell by more than eight months in 2021, leaving the Golden State in 10th place in the country, according to a new report from the Centers for Disease Control and Prevention.
An analysis of all 50 states and the District of Columbia found that babies born in California in 2021 could expect to live 78.3 years, down from 79 years in 2020, when California ranked fourth in the nation.
The decline, which was reported Wednesday by the CDC’s National Vital Statistics System, revealed that the promise of COVID-19 vaccines, along with other public health measures, was not being enjoyed evenly across the country.
While life expectancy declined in California and 38 other states, it rose in 11 others and remained stable in the District of Columbia. (New Jersey recorded a gain of 1.5 years between 2020 and 2021, the best performance among the states.)
In 2019, before the coronavirus reached U.S. shores, overall life expectancy at birth in the state was 80.9 years, with a life expectancy of 78.4 years for men and 83.3 years for women. That put California in second place, just behind Hawaii. (The states were so close that Hawaii’s overall life expectancy that year was also reported as 80.9 years.)
Deaths during the first year of the pandemic then reduced life expectancy at birth in California by 1.9 years. Only 15 states suffered larger declines (New York experienced the largest drop, losing 3 full years of life expectancy between 2019 and 2020).
According to the new report, life expectancy in the Golden State dropped another 0.7 years in 2021. That’s the 27th largest decline, putting it in the middle of the pack. (The biggest drop was in Alaska, where it plummeted from 76.6 to 74.5 years.)
This map divides states into quartiles based on their life expectancy at birth for 2021. The darker the state, the higher the life expectancy.
(National Center for Health Statistics, National Vital Statistics System)
According to the new report, life expectancy for Americans overall dropped by 0.6 years, to 76.4 years. CDC researchers attributed that decline primarily to high numbers of COVID-19 deaths and deaths from accidental drug overdoses.
Hawaii retained the longevity crown in 2021, with a life expectancy of 79.9 years.
That was nine years longer than Mississippi, which ranks 51st among all states and the District of Columbia. A baby born in the Magnolia State could expect to live 70.9 years, according to the new report.
States rounding out the top five overall in 2021 were Massachusetts (79.6 years), Connecticut (79.2 years), New York (79.0), and New Jersey (also 79.0).
Joining Mississippi at the bottom of the list are West Virginia (71.0 years), Alabama (72.0 years), Louisiana (72.2 years) and Kentucky (72.3 years).
More broadly, “the states with the lowest life expectancy at birth were predominantly Southern states,” the report notes. “The states with the highest life expectancy at birth were predominantly Western states… and Northeastern states.”
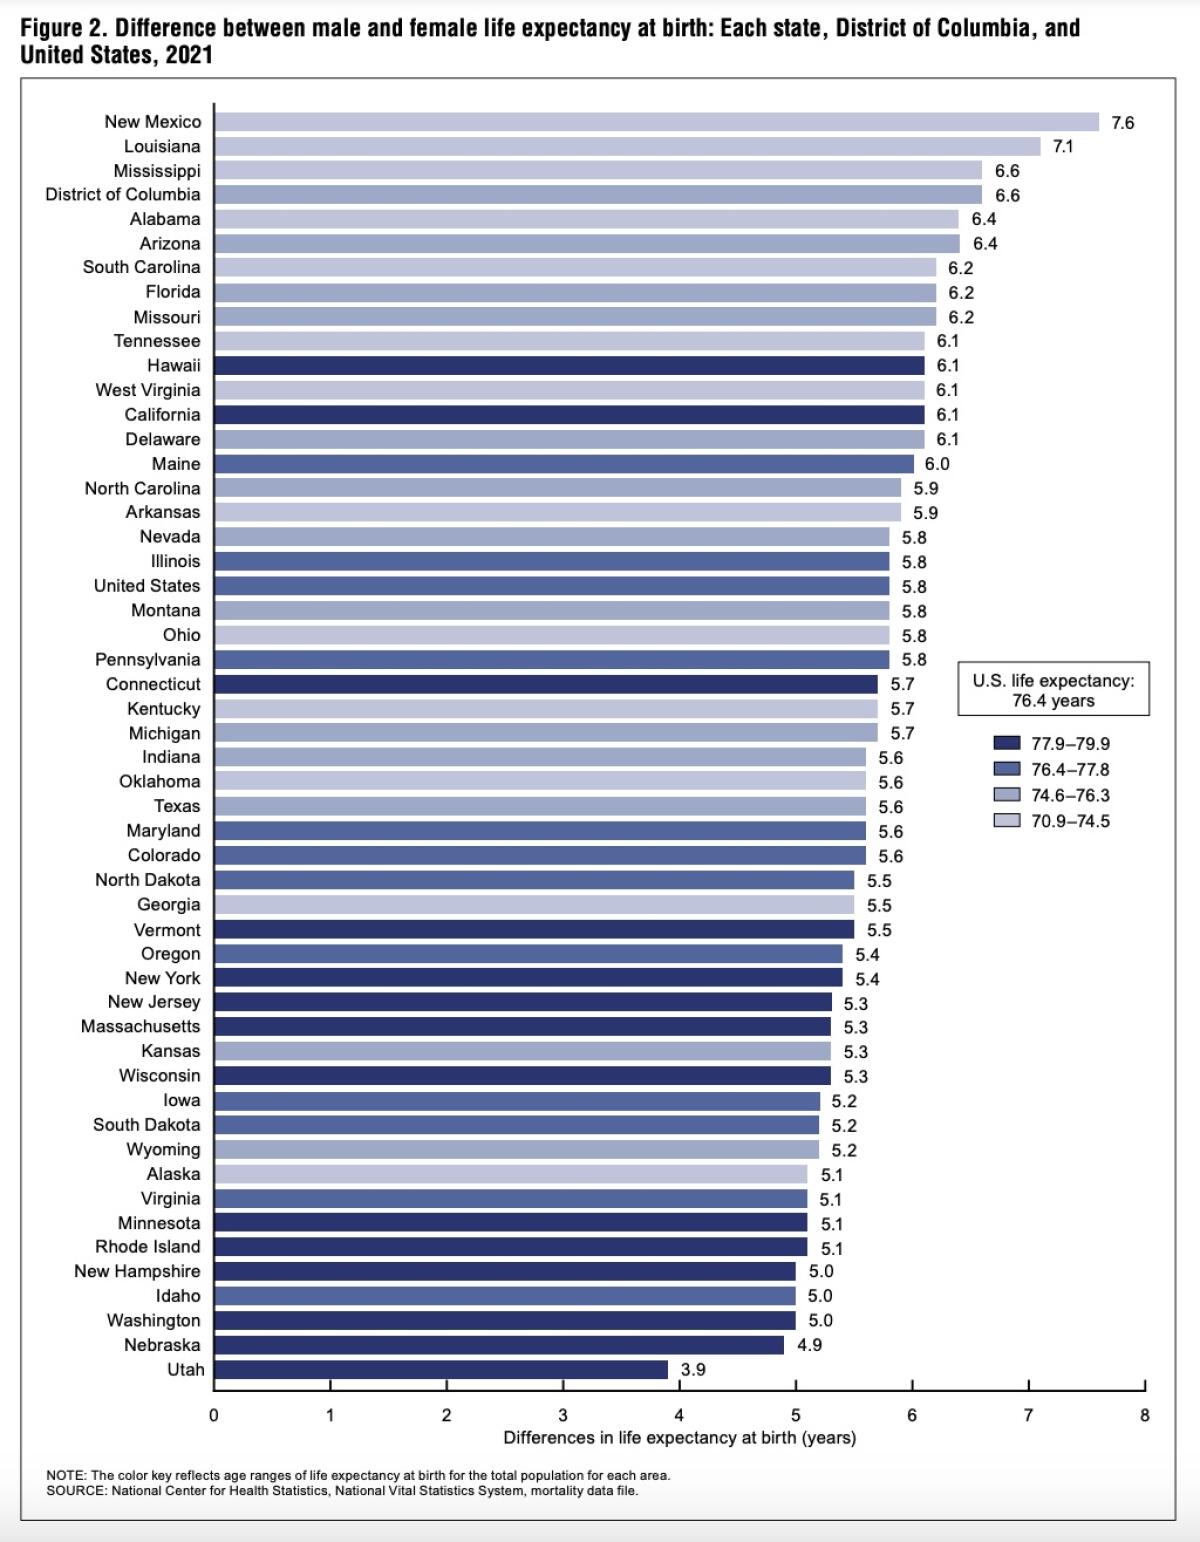
Women were expected to live longer than men in every state in 2021. The life expectancy gap ranged from a high of 7.6 years in New Mexico to a low of 3.9 years in Utah. The average gender gap for the country as a whole was 5.8 years, according to the report.
In California, life expectancy was 81.4 years for a girl born in 2021 and 75.3 years for a boy, a difference of 6.1 years.
Overall, states with the largest gender gap had lower overall life expectancy, while states with the smallest gender gaps tended to have higher overall life expectancy, the CDC found.

This chart ranks states by the size of their gender gap in life expectancy at birth in 2021. New Mexico had the largest discrepancy, while Utah had the smallest.
(National Center for Health Statistics, National Vital Statistics System)
CDC researchers also estimated the remaining life expectancy for Americans who were 65 in 2021. The national average was 18.4 years: 17.0 years for men and 19.7 years for women.
Life expectancy at age 65 is always higher than life expectancy at birth because the group of people who survive to age 65 excludes those who failed to reach that milestone.
The risk of death in the first year of life is particularly high (the US infant mortality rate in 2021 was 5.44 deaths per 1,000 live births), and the Social Security Administration's actuarial mortality tables show that it takes until age 49 for the mortality rate to reach the same level.
In 2021, Hawaiians aged 65 years and older had the most years left, with an average remaining life expectancy of 20.6 years. They were followed by Connecticut at 19.9 years, Massachusetts at 19.6 years, and Minnesota, New York, Vermont and New Jersey at 19.4 years.
Mississippi also ranks 51st on this longevity list, offering 65-year-olds an additional 16.1 years of life expectancy. West Virginia also has a remaining life expectancy of 16.1 years, followed by Alabama, Oklahoma and Kentucky at 16.4 years.
California outperformed national averages for people age 65, with a total remaining life expectancy of 19.3 years. That included an additional 17.8 years for 65-year-old men and 20.7 years for 65-year-old women.


