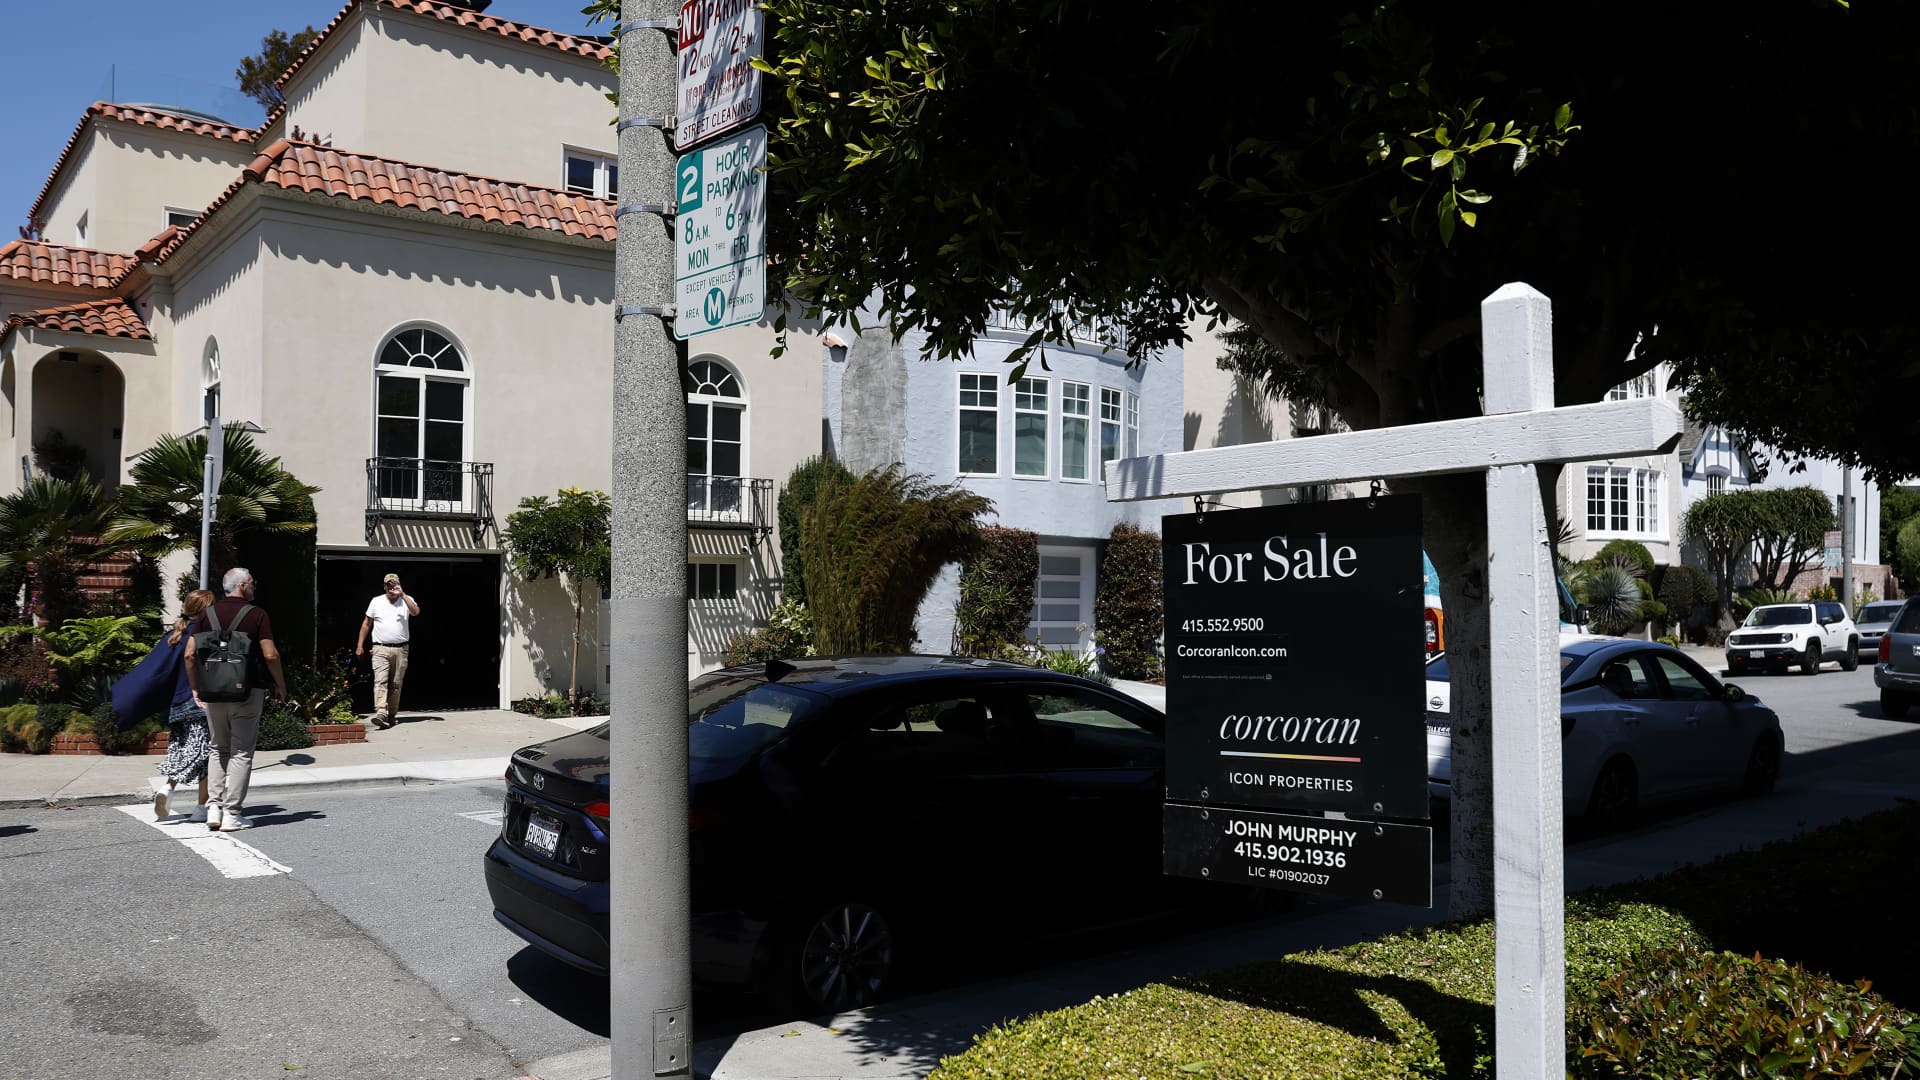
Anyone looking for a home today knows that there is still very little to sell.
The housing market is starting to emerge from its slowest years in history. The inventory of new and existing homes is finally increasing, but there's something strange about the numbers: the supply of newly built homes appears to be too high.
However, the numbers are misleading because of the unprecedented dynamics of the current housing market, which dates back two decades to another unprecedented period in the real estate industry: the subprime mortgage boom.
All of this is precisely why home prices, which normally fall when supply is high, continue to rise.
The supply scenario
According to the National Association of Home Builders (NAHB), there is currently a 4.4-month supply of new and existing homes for sale. The months supply is a common calculation used in the market to measure how long it would take to sell all available homes at the current sales rate. A six-month supply is considered a balanced market between a buyer and a seller.
Supply was already low earlier this decade, but pandemic-driven demand pushed it to a record low in early 2021, with just two months’ supply. That shortage of homes for sale, combined with strong demand, sent home prices up more than 40% from pre-pandemic levels.
Now supply is finally starting to pick up, but the gains are coming primarily in the new-home market, not the existing-home market. In fact, there is now a nine-month supply of new homes for sale, nearly three times the supply of existing homes. The monthly supply of new and older homes typically follows a fairly similar trajectory. New construction now accounts for 30% of total inventory, roughly double its historical share, according to the NAHB.
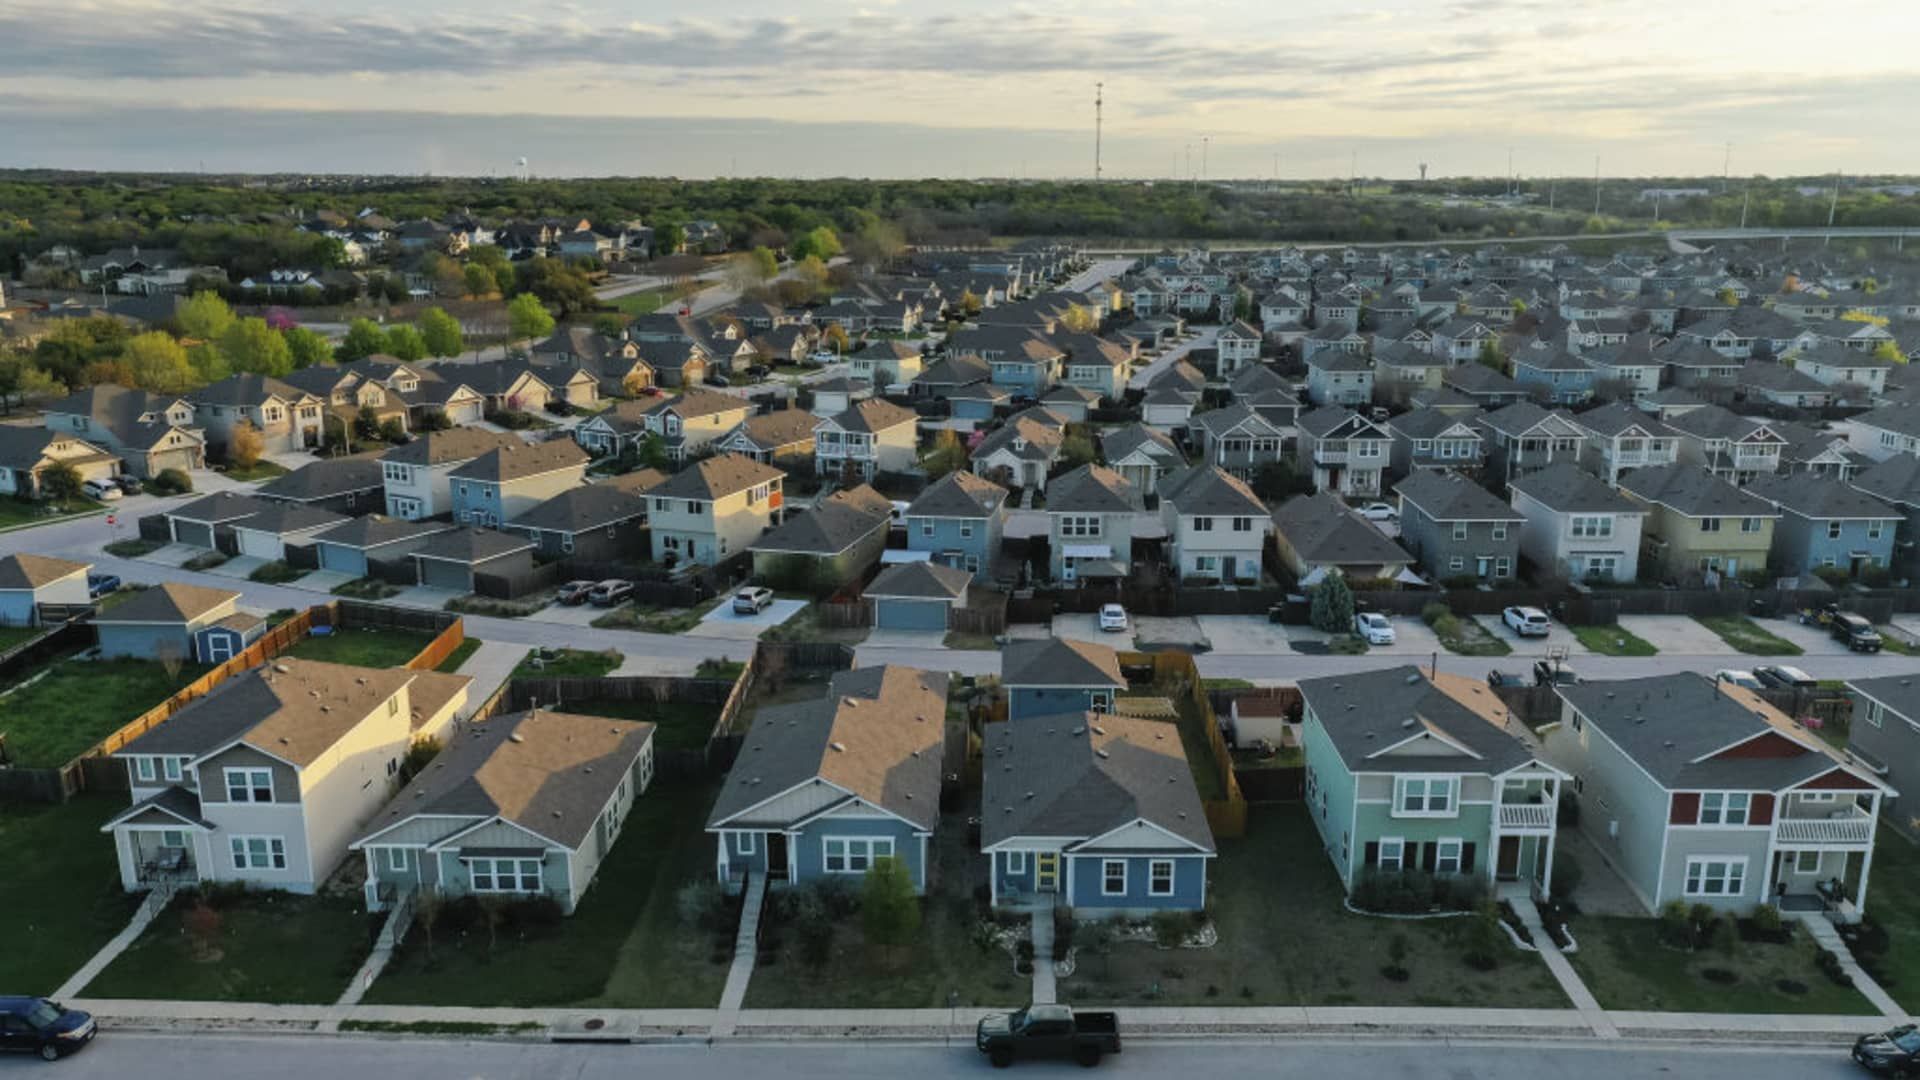
Single-family homes in a residential neighborhood in San Marcos, Texas.
Jordan Vonderhaar | Bloomberg | Getty Images
“June 2022 saw the largest gap in history between the monthly supply of new homes (9.9) and the monthly supply of existing single-family homes (2.9),” wrote Robert Dietz, NAHB chief economist. “This separation makes clear that an assessment of current market inventory cannot simply examine existing or new housing inventory in isolation.”
This unusual dynamic has been driven both by recent swings in mortgage rates and by an unprecedented housing market disaster that began 20 years ago.
The basis of today's complicated numbers
This housing market is unlike any other because of economic forces unlike any other. First, in 2005, there was a massive surge in home sales, home construction, and home prices, driven by a surge in subprime mortgage lending and a frenzy of trading in new financial products backed by these mortgages.
All of this quickly came crashing down, resulting in one of the worst foreclosure crises since the Great Depression and triggering the ensuing Great Recession. Single-family home construction starts plummeted from a peak of 1.7 million units in 2005 to just 430,000 in 2011. By 2012, new homes accounted for just 6% of total supply for sale, and even in 2020, housing starts had yet to recover to their historical average of about 1.1 million units. They remained at 990,000.
Then came the Covid-19 pandemic, and during that time, consumer demand surged and mortgage rates hit more than a dozen record lows, so builders responded. Housing starts soared to 1.1 million in 2021. The Federal Reserve was bailing out the economy, making home buying much cheaper, and the new work-from-home culture had Americans moving like never before. Suddenly, supply was sucked into a tornado of demand.
The chaos of mortgage rates
The current strange gap in supply between new-build and existing homes is also due to fluctuations in mortgage interest rates, which fell to historic lows at the start of the pandemic and then soared to 20-year highs just two years later. Millions of borrowers refinanced their loans at the lows and now have no desire to move because they would have to trade a 3% or 4% interest rate on their loans for the current rate, which is around 7%. This lock-in effect caused new housing supply to dry up.
It also put builders in the driver’s seat. Homebuilders had already ramped up production in the early years of the pandemic, with single-family homes rising to more than 1.1 million in 2021, according to the U.S. Census, before falling back as mortgage rates soared. Builders have been able to lower mortgage rates to keep sales up, but as of May of this year, they are building at an annualized pace of 992,000.
According to Redfin, listings for previously owned homes improved slightly this spring as mortgage rates dipped slightly, and in June, active listings were 16.5% higher than a year earlier. However, part of that increase in supply was due to listings sitting on the market longer.
“The share of homes staying on the market for at least a month has been increasing year-over-year since March, when growth in new listings accelerated but buyer demand remained tepid, as it has since mortgage rates began to rise in 2022,” according to a Redfin report.
A home is shown available for sale in Austin, Texas on May 22, 2024.
Brandon Bell | Getty Images
Growth at the lower end
In the resale market, supply is lowest in the $100,000 to $500,000 price range, according to the National Association of Realtors. That's where the bulk of today's buyers are. Higher mortgage rates are driving them to seek out cheaper homes.
What's more interesting, however, is that while supply is increasing at all price levels, it is at the lowest price level itself that it is increasing the most, meaning there simply isn't enough. As homes come on the market, they are being put up for sale.
For example, there is a supply of homes for sale between $100,000 and $250,000 for only 2.7 months, but supply is up 19% from a year ago. Meanwhile, there is a supply of homes priced above $1 million for 4.2 months, but supply is up only 5% from a year ago.
This explains why home prices remain stubbornly high, even with supply improving. Prices in May, the latest reading, were 4.9% higher than in May 2023, according to CoreLogic. The gains have started to slow slightly, but not everywhere.
“Increasingly strong home price gains are continuing this spring in markets where inventory is well below pre-pandemic levels, such as those in the Northeast,” said Selma Hepp, chief economist at CoreLogic.
“Additionally, markets that are relatively more affordable, such as those in the Midwest, have seen healthy price growth this spring.”
Hepp notes that Florida and Texas, which are experiencing comparatively greater growth in the supply of homes for sale, are now seeing prices below where they were a year ago.
While analysts had expected prices to moderate and mortgage rates to decline in the second half of this year, it remains to be seen whether rates will actually decline and whether the imbalance between supply and demand will allow prices to cool. If mortgage rates decline, demand will surely increase, putting even more pressure on supply and keeping prices elevated.
“Yes, inventory is increasing and will continue to increase, particularly as the lock-in effect on mortgage rates subsides in the coming quarters. But current inventory levels continue to support, nationally, new home construction and some price growth,” Dietz added.